TECHNICAL ANALYSIS SOFTWARE FOR NINJATRADERTM
Why iCinDERTM Indicators
The approach taken by iCinDER™ Trader services and development is to combine existing proven methodologies into indicators that can provide a cyclical view as to the direction of market movement and movement of financial instruments. The proprietary cyclical indicators and filters are able to visualize multiple dimensions of an object and capture the pure impulse movement of the evaluated object, in this case stocks, indices and other financial instruments.
The basis for the indicators are cyclical movements of based on price movement of financial instruments. As with all services and reports, our services and custom indicators are meant to be used with other reports and services you may be familiar with and to make sure that you can have confirmation of the output that is provided by iCinDER indicators.
Analyze financial instruments
- Market and Stock cycles
- Market Timing
- Trend Strength and Velocity
- Range of price change
- Range of Movement
- Integrate with SharkIndicators' Bloodhound Ultimate

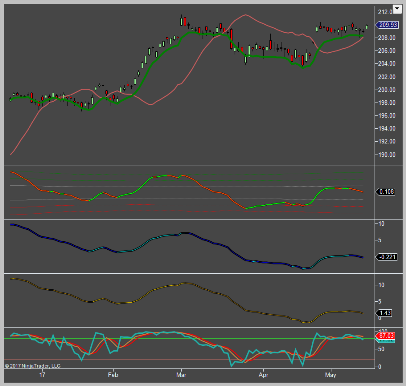
iCinDERTM Cycles Basic Cycles Pack
- iCinDER v2s - Minor Cycle
- iCinDER v2i -Intermediate Cycle
- iCinDER v2m - Major Cycle
- iCinDER ranger for V2 Cycles providing price excursion for overbought/oversold visualization.
- iCinDER V2 Stochastic providing stochastic filter to the v2 Minor Cycle
- iCinDER Velocity Band which when applied to the price panel provide visualization of bullish and bearish movement of price as related to the minor cycle.
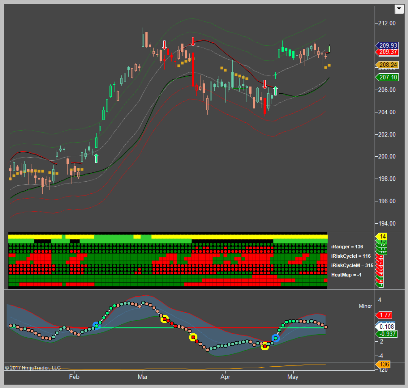
iCinDERTM Cycles VF (Velocity Force)
Velocity Force indicators provide additional tools and includes iCinDERTM Cycles Basic Pack.
- iCinDER Channel SD provides a quasi-Stop/Reverse visualization tool that can be used in Risk Management as well as evaluating price movement bias.
- iCinDER HeatMap CF is an analysis tool that validates the state of the indicators showing a bullish or bearish bias of each measured indicator. This tool will allow for a quick validation of analysis, thus speeding up reaction time to market movement's bias.
- iCinDER ranger Bar provides a statistical range value of each bar and can measure this value on any periodicity.
- iCinDER ranger Bands provide price excursion for overbought/oversold visualization by using the Ranger value but displaying the values as bands in the price pane.
- iCinDER v2 Bands builds upon the basic cycles and provides a volatility filter to help with visualization of cycle's directional bias change.
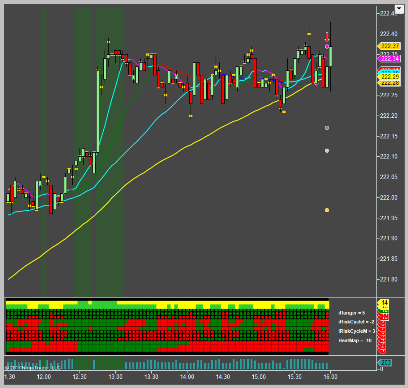
iCinDERTM Cycles MF indicators
Internal Market Forces and Trend Analysis guides includes iCinDERTM Cycles Basic Pack and iCinDERTM Cycles VF and completes the iCinDER Analysis toolset for the trader.
- iCinDER Cycles IMF show Point of Control on a per bar basis with 1 user setting for Moving Average of Point of Control and 3 Averages providing cycles at Minor, Intermediate and Major measures.
- iCinDER HeatMap MF provides a heat map measuring component providing fast validation of analysis and speeding up reaction time to market movement's bias.
- iCinDER TrendGuide RT is a guide in scalping providing measured targets based on movement of market and volatility. This tool was developed in 2007 and was mainly used with 1 hour bar to provide feedback into market movement in the minor time cycle. IT IS NOT A TRADING TOOL FOR AUTOMATION OF ANALYSIS AND TRADING AND SHOULD BE USED ONLY AS A GUIDE FOR TREND.
- iCinDER TrendGuide XP is a quick analysis tool that provides user with a colored background as to bullish or bearish bias. THIS TOOL IS A QUICK ANALYSIS TOOL AND SHOULD BE VALIDATED BY USING OTHER INDICATORS AS WELL AS MARKET PROFILE.